Graphene Manufacturing Group Ltd. Announces Closing of Bought Deal Financing

Graphene Manufacturing Group Ltd. (TSXV: GMG) (“GMG” or the “Company“) is pleased to announce that it has completed its previously announced bought deal offering of 7,245,000 units (the “Units“) at a price of C$0.80 per Unit (the “Offering Price“) for aggregate gross proceeds to the Company of C$5,796,000, which includes the exercise in full of the Underwriters’ (as defined below) over-allotment option for 945,000 Units (the “Offering“).

Each Unit will consist of one common share of the Company (each, a “Unit Share“) and one common share purchase warrant (each a “Warrant“). Each Warrant shall be exercisable into one additional common share of the Company for a period of 36 months from the closing of the Offering at an exercise price of C$1.10.

Under the Offering, Ventum Financial Corp. acted as lead underwriter and sole bookrunner on behalf of a syndicate of underwriters including Red Cloud Securities Inc. (the “Underwriters“) pursuant to the underwriting agreement entered into between the Underwriters and the Company dated March 14, 2025.

The Offering was completed pursuant to a prospectus supplement dated March 14, 2025 to the short form base shelf prospectus of the Company dated March 7, 2025 in each of the provinces of Canada (except Quebec), in the United States on a private placement basis pursuant to an exemption from the registration requirements of the U.S. Securities Act of 1933, as amended (the “U.S. Securities Act“) and applicable state securities laws and other jurisdictions outside of Canada and the United States on an exempt basis, provided that the issuance of the Units (including the underlying securities) is permitted under laws applicable to the Company (including the Australian Corporations Act 2001 (Cth). The Offering remains subject to the final approval of the TSX Venture Exchange.

The Company intends to use the net proceeds of the Offering to expand its production capacity to increase sales, continue ongoing research and development to progress the Graphene Aluminium-Ion Battery with the Battery Innovation Center of Indiana, prepare to uplist on a major United States exchange and working capital and general corporate purposes.

In connection with the Offering, the Company paid the Underwriter a cash commission equal to 7% of the gross proceeds of the Offering and issued to the Underwriter such number of compensation warrants as is equal to 7% of the number of Units sold pursuant to the Offering (the “Compensation Warrants“). Each Compensation Warrant is exercisable into a Unit Share at the Offering Price until 36 months from the closing of the Offering.

This news release does not constitute an offer to sell or a solicitation of an offer to sell any of securities in the United States. The securities have not been and will not be registered under the U.S. Securities Act or any state securities laws and may not be offered or sold within the United States or to U.S. persons as defined under Regulation S, unless registered under the U.S. Securities Act and applicable state securities laws or an exemption from such registration is available.

About GMG:

GMG is an Australian based clean-technology company which develops, makes and sells energy saving and energy storage solutions, enabled by graphene manufactured via in house production process. GMG uses its own proprietary production process to decompose natural gas (i.e. methane) into its natural elements, carbon (as graphene), hydrogen and some residual hydrocarbon gases. This process produces high quality, low cost, scalable, ‘tuneable’ and low/no contaminant graphene suitable for use in clean-technology and other applications.

The Company’s present focus is to de-risk and develop commercial scale-up capabilities, and secure market applications. In the energy savings segment, GMG has initially focused on graphene enhanced heating, ventilation and air conditioning (“HVAC-R“) coating (or energy-saving coating) which is now being marketed into other applications including electronic heat sinks, industrial process plants and data centres. Another product GMG has developed is the graphene lubricant additive focused on saving liquid fuels initially for diesel engines.

In the energy storage segment, GMG and the University of Queensland are working collaboratively with financial support from the Australian Government to progress R&D and commercialization of graphene aluminium-ion batteries (“G+AI Batteries“). GMG has also developed a graphene additive slurry that is aimed to improve the performance of lithium-ion batteries.

GMG’s 4 critical business objectives are:

  1. Produce Graphene and improve/scale cell production processes
  2. Build Revenue from Energy Savings Products
  3. Develop Next-Generation Battery
  4. Develop Supply Chain, Partners & Project Execution Capability

For further information please contact:

  • Craig Nicol, Chief Executive Officer & Managing Director of the Company at craig.nicol@graphenemg.com, +61 415 445 223
  • Leo Karabelas at Focus Communications Investor Relations, leo@fcir.ca, +1 647 689 6041

Cautionary Note Regarding Forward-Looking Statements

This news release includes certain statements and information that may constitute forward-looking information within the meaning of applicable Canadian securities laws. Forward-looking statements relate to future events or future performance and reflect the expectations or beliefs of management of the Company regarding future events. Generally, forward-looking statements and information can be identified by the use of forward-looking terminology such as “intends”, “expects” or “anticipates”, or variations of such words and phrases or statements that certain actions, events or results “may”, “could”, “should”, “would” or will “potentially” or “likely” occur. This information and these statements, referred to herein as “forward‐looking statements”, are not historical facts, are made as of the date of this news release and include without limitation, the business objectives, focus and strategy of the Company; ongoing R&D of the Company; the anticipated use of proceeds of the Offering; the receipt of all necessary approvals, including the final approval of the TSX Venture Exchange.

Such forward-looking statements are based on a number of assumptions of management, including, without limitation, expectations and assumptions concerning the business objectives of the Company; the Company’s ability to carry out current planned capital projects, research and development, manufacturing, production, sales and marketing programs for its graphene and graphene-enhanced products and solutions; receipt of all necessary approvals the Company’s ability to list Common Shares on the TSX Venture Exchange; the Company’s performance and general business and economic conditions.

Additionally, forward-looking information involves a variety of known and unknown risks, uncertainties and other factors which may cause the actual plans, intentions, activities, results, performance or achievements of GMG to be materially different from any future plans, intentions, activities, results, performance or achievements expressed or implied by such forward-looking statements. Such risks include, without limitation: overall economic conditions, technical de-risking and market acceptance for the Company’s products and solutions; the introduction of competing technologies or products; stock market volatility; environmental and regulatory requirements; competitive pressures; change in market conditions and other factors that may cause the actual results, performance or achievements of the Company to differ materially from those expressed or implied in these forward looking statements; risks relating to the extent and duration of the conflict in Eastern Europe and the Middle East and its impact on global markets, the volatility of global capital markets, political instability, the failure of the Company to obtain regulatory approvals, attract and retain skilled personnel, unexpected development and production challenges, unanticipated costs and the risk factors set out under the heading “Risk Factors” in the Company’s annual information form dated October 3, 2024 available for review on the Company’s profile at www.sedarplus.ca.

Although management of the Company has attempted to identify important factors that could cause actual results to differ materially from those contained in forward-looking statements or forward-looking information, there may be other factors that cause results not to be as anticipated, estimated or intended. There can be no assurance that such statements will prove to be accurate, as actual results and future events could differ materially from those anticipated in such statements. Accordingly, readers should not place undue reliance on forward-looking statements and forward-looking information. Readers are cautioned that reliance on such information may not be appropriate for other purposes. The Company does not undertake to update any forward-looking statement, forward-looking information or financial out-look that are incorporated by reference herein, except in accordance with applicable securities laws.

NOT FOR DISTRIBUTION TO THE U.S. NEWSWIRE OR FOR DISSEMINATION IN THE UNITED STATES

Corporate Logo

To view the source version of this press release, please visit https://www.newsfilecorp.com/release/245420

Q2 Metals Intercepts 179.6 Metres of Continuous Spodumene Pegmatite in Large Step-Out at the Cisco Lithium Project in Quebec, Canada

Highlights:

  • Drill hole CS25-027 encountered seven (7) spodumene pegmatite intervals, with the widest continuous interval of 179.6 metres (m), followed by two additional intervals of 58 m and 91.8 m of continuous spodumene pegmatite.
  • Drill hole CS25-024/24A intersected a total of six (6) individual spodumene pegmatite intervals, with the widest continuous interval of 39.5 m.
  • Drill hole CS25-025 encountered nine (9) spodumene pegmatite intervals, with the widest continuous interval of 20.4 m.
  • Drill hole CS25-026 encountered 10 spodumene pegmatite intervals, with the widest continuous interval of 21.2 m.
  • Assays are pending on the approximately 2,570 m of core drilled in the first four (4) holes completed to date in the winter drill campaign at the Cisco Project.
  • Drilling continues with step outs to both the east and south.

Vancouver, BC, Mar 19, 2025 – (ACN Newswire) – Q2 Metals Corp. (TSXV:QTWO)(OTCQB:QUEXF)(FSE:458) (“Q2” or the “Company“) is pleased to announce the completion of the first four holes of the winter 2025 expansion drilling campaign at the Company’s Cisco Lithium Project (the “Project” or the “Cisco Project”), located within the greater Nemaska traditional territory of the Eeyou Istchee James Bay, Quebec, Canada.

Multiple wide intercepts of continuous spodumene pegmatite were encountered within a total of 2,570 metres of drilling completed to date, significantly increasing the extent of previously encountered mineralization (see Figure 1). All holes intercepted pegmatites with visual indications of spodumene mineralization identified.

“We are extraordinarily pleased with these initial findings from our winter campaign which has not only produced one of our top holes in terms of the total amount of spodumene pegmatite per hole, but continues to provide important information about the mineralization at Cisco,” said Q2 Metals President and CEO Alicia Milne. “We are continuing to explore the robust and continuous nature of Cisco’s mineralization with additional step outs to both the south and east.”

“The first four holes of the winter drill program have expanded the strike length of the mineralized system and has confirmed that it continues to extend to the south, further increasing Cisco’s potential scale,” said Q2 VP Exploration Neil McCallum. “Hole-27, with 179.6 metres of continuous spodumene pegmatite, plus an additional 58 and 91.8 metres of continuous spodumene pegmatite, lends further support to our theory of a south-trending mineralized system, which now extends over a kilometre.”

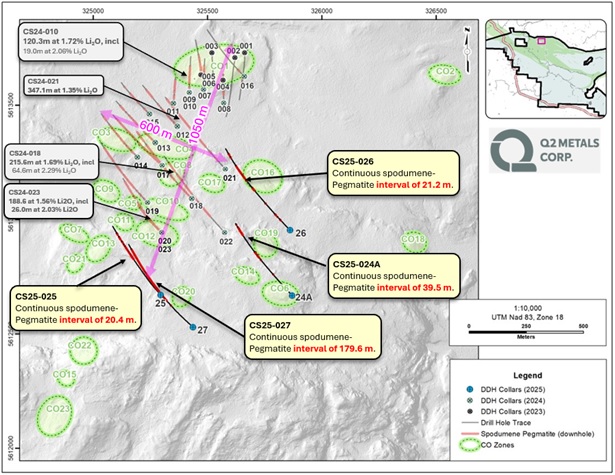
Figure 1. Map of Drilling area, Cisco Project

Winter 2025 Exploration Program OverviewThe current 2025 Winter Program is targeting 6,000 – 8,000 m of drilling with 200 – 400 m step outs with the primary objective of expanding upon the exceptionally promising drill results from the inaugural 2024 campaign, which included:

  • Drill hole CS-24-018 – 215.6 m at 1.69% Li 2 O;
  • Drill hole CS-24-021 – 347.1 m at 1.35% Li 2 O; and
  • Drill hole CS-24-023 – 188.6 m at 1.56% Li 2 O.

One diamond drill rig tested to the southwest of drill hole CS-24-023 to define the strike length:

  • Drill hole CS25-025 was collared approximately 275 m south of hole CS24-023; and
  • Drill hole CS25-027 is located 200 m southeast of hole CS25-025.

This fence of holes was designed to test the southward extension of the large and wide mineralized system and did so successfully with hole CS25-027’s widest continuous interval of 179.6 m of spodumene-bearing pegmatite.

One diamond drill rig tested to the east of drill holes CS-24-018 and CS-24-021 to define potential additional parallel pegmatite zones:

  • Drill hole CS25-024A was drilled as a follow-up to hole CS25-024 which was lost due to difficult drilling conditions. It was collared approximately 400 m southeast of hole CS24-022; and
  • Drill hole CS25-026 was collared approximately 400 m from CS24-021 and 285 m north of hole CS25-024A.

Drilling remains ongoing, with step outs continuing both east and south.

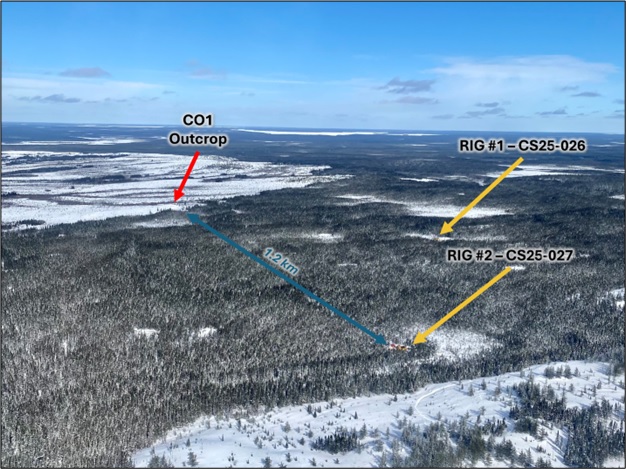
Figure 2. Drill Rig Locations at the Cisco Lithium Project

Summary of Spodumene-Bearing Pegmatite Intervals

The pegmatite intervals (greater than 2 m) of drill holes CS-25-024A to 027 are reported below in detail (Table 1).

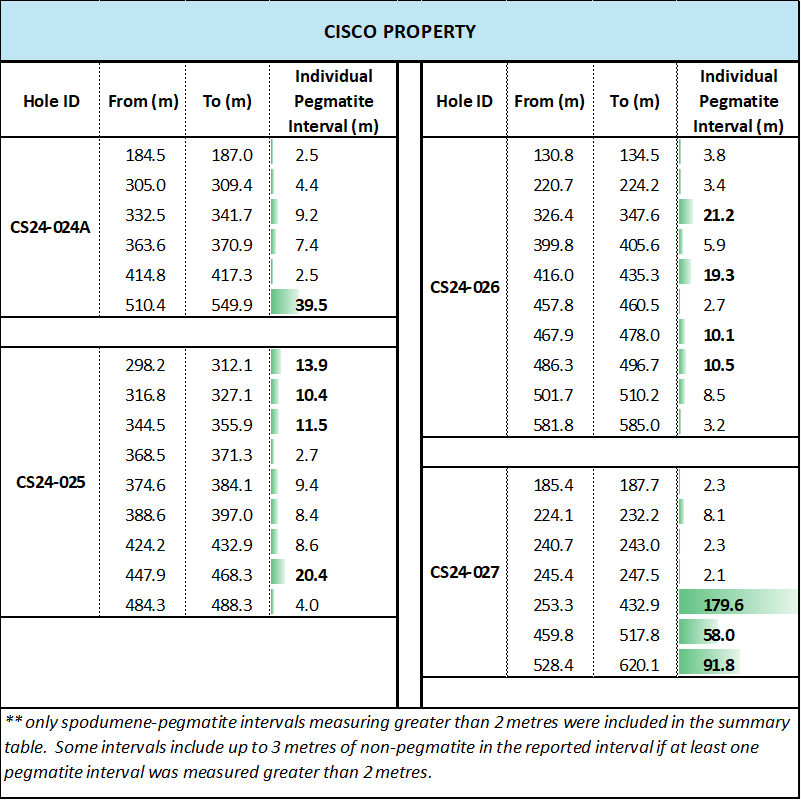
Table 1. Summary of Spodumene-Pegmatite Intervals, Cisco Project

The mineralized intervals in all the holes are not necessarily representative of the true width and the modelled pegmatite zones are being refined with every additional hole.

Cautionary Statement: The presence of pegmatites does not confirm the presence of lithium (spodumene or other lithium minerals). Pegmatites are fractionated coarse grained igneous rocks commonly associated with lithium mineralization; however, many pegmatites do not contain mineralization. The presence of any mineralization can only be confirmed with assaying.

The geological team has completed the core cutting and logging of holes CS25-024/24A to CS25-027 and the samples have been dispatched to the SGS Canada preparation laboratory located in Val-d’Or, QC for mineral analysis to confirm the presence of lithium.

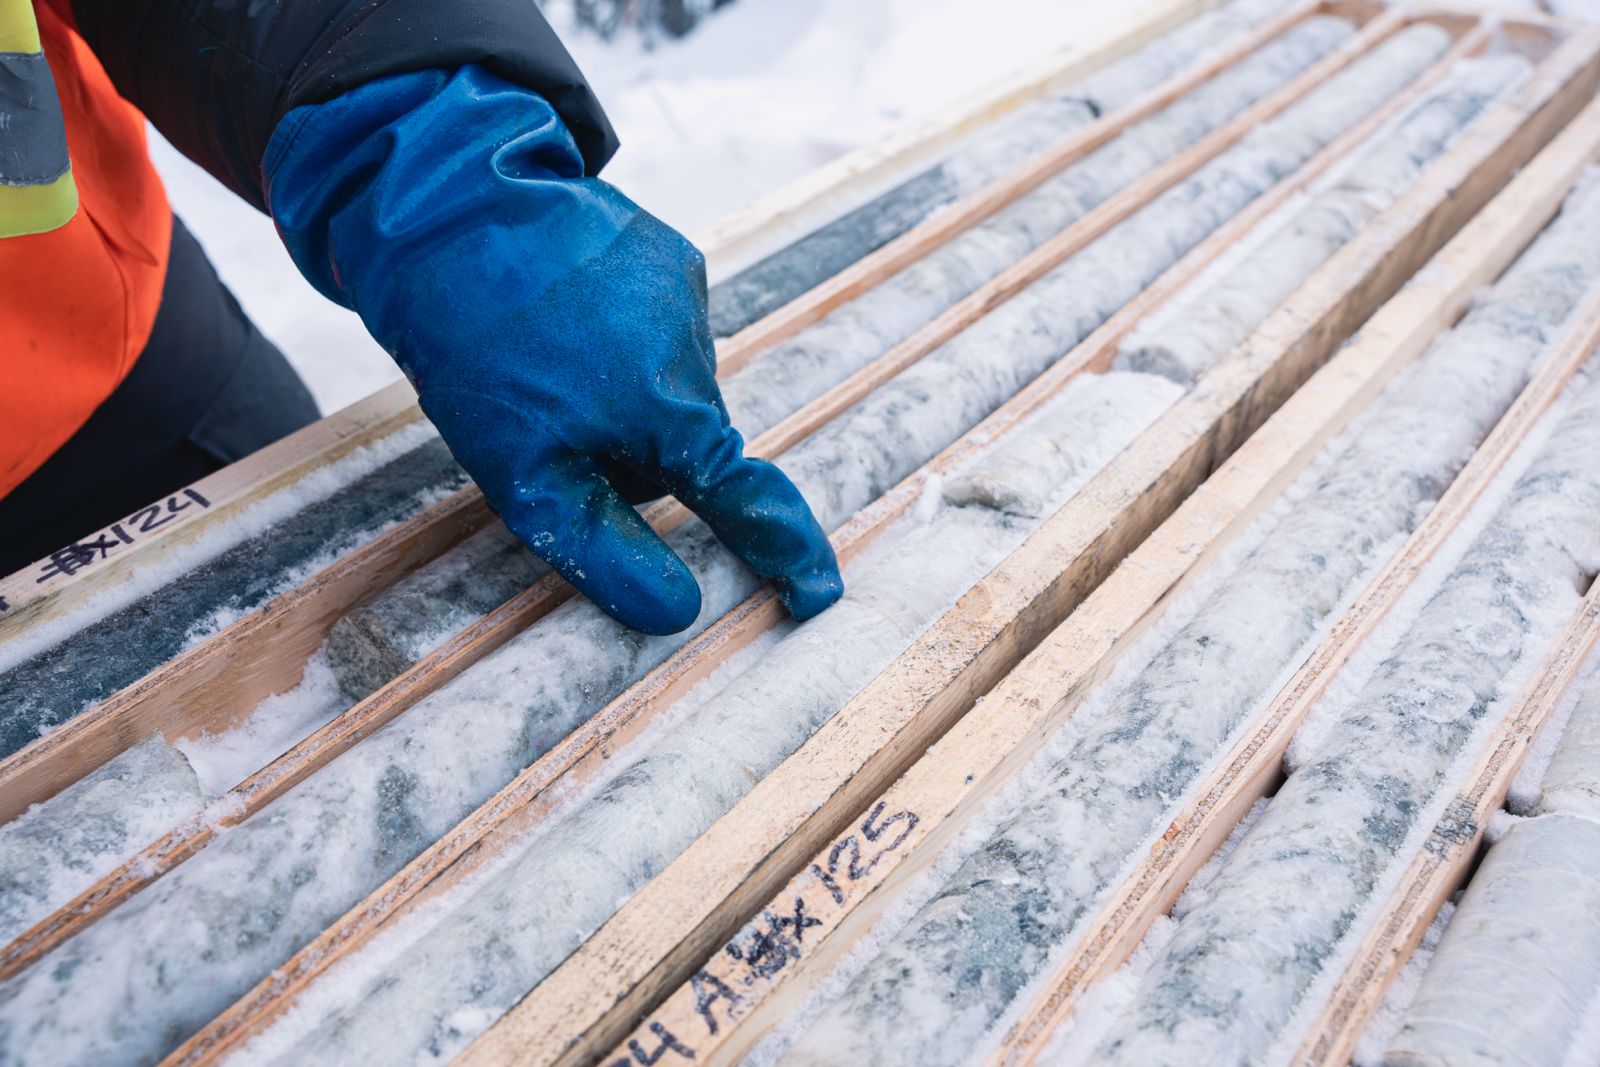
Figure 3. Core from the Current Drill Program at Cisco Lithium Project
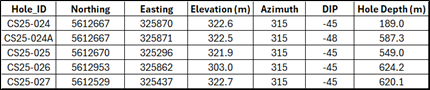
Sampling, Analytical Methods and QA/QC ProtocolsAll drilling was conducted using diamond drill rig with NQ sized core and all drill core samples are shipped to SGS Canada’s preparation facility in Val D’Or, Quebec, for standard sample preparation (code PRP92) which includes drying at 105°C, crushing to 90% passing 2 mm, riffle split 500 g, and pulverize 85% passing 75 microns. The pulps are then shipped by air to SGS Canada’s laboratory in Burnaby, BC, where the samples are homogenized and subsequently analyzed for multi-element (including Li and Ta) using sodium peroxide fusion with ICP-AES/MS finish (code GE_ICM91A50). The reported Li grade will be multiplied by the standard conversion factor of 2.153 which results in an equivalent Li 2 O grade. Drill core was saw-cut with half-core sent for geochemical analysis and half-core remaining in the box for reference. The same side of the core was sampled to maintain representativeness.

A Quality Assurance / Quality Control (QA/QC) protocol following industry best practices was incorporated into the sampling program. Measures include the systematic insertion of quartz blanks and certified reference materials (CRMs) into sample batches at a rate of approximately 5% each. Additionally, analysis of pulp-split and reject-split duplicates was completed to assess analytical precision. The QP has verified the QA/QC results of the analytical work.

Drill Hole Collar InformationThe summary of drill holes completed to date, including basic location and dip/azimuth is detailed below (Table 2).

  • Coordinates are in UTM NAD83, zone 18
  • All holes are NQ-Size diamond drill core
  • Azimuth and dip are reported as planned, and will deviate down-hole
  • Reported hole depths are subject to minor changes based on final core observations

Table 2. Summary of Drill Hole Collar Information, Cisco Project (CS25-024-027)

Upcoming Events

Ignite Investment Sumit

The Company will be attending the Ignite Investment Summit in Hong Kong March 26-27, 2025.

For more information, click here.

Future Facing Commodities Conference

The Company will be attending and exhibiting at the Tribeca Future Facing Commodities 2025 Conference in Singapore on April 1-3, 2025.

For more information, click here.

About Q2 Metals Corp

Q2 Metals is a Canadian mineral exploration company focused on the Cisco Lithium Project located within the greater Nemaska traditional territory of the Eeyou Istchee, James Bay, Quebec, Canada where drilling is currently underway.

The Cisco Project is comprised of 767 claims, totaling 39,389 hectares. The main mineralized zone is just 6.5 kilometres (“km”) away from the Billy Diamond Highway and transects the Project. The town of Matagami, which features direct rail link to much of James Bay, is approximately 150 km to the south.

Cisco has district-scale potential with an already identified mineralized zone and 2024 discovery drill results that include:

  • 120.3 metres at 1.72% Li 2 O (hole CS-24-010);
  • 215.6 metres at 1.69% Li 2 O (hole CS-24-018);
  • 347.1 metres at 1.35% Li 2 O (hole CS-24-021); and
  • 188.6 metres at 1.56% Li 2 O (hole CS-24-023)

The Cisco Project is situated along the Frotet Evans Greenstone Belt, comprised of a volcanic package dominated by mafic to felsic metavolcanic rocks, of the southern James Bay Lithium District, the same belt that hosts the Sirmac and Moblan lithium deposits, located 130 km and 180 km away, respectively.

FOR FURTHER INFORMATION, PLEASE CONTACT:

Alicia Milne, President & CEO, Alicia@Q2metals.com

Jason McBride, Corporate Communications, Jason@Q2metals.com

Chris Ackerman, Corporate Communications, Chris@Q2metals.com

Telephone: 1 (800) 482-7560, E-mail: info@Q2metals.com www.Q2Metals.com

Click to follow us online:

XLinkedInFacebook, and Instagram

Qualified Person

Neil McCallum, B.Sc., P.Geol, a registered permit holder with the Ordre des Géologues du Québec and Qualified Person as defined by NI 43-101 (“QP”), has reviewed and approved the technical information in this news release. Mr. McCallum is a director and VP Exploration for Q2.

Forward-Looking Statements

This news release contains forward-looking statements and forward-looking information (collectively, “forward-looking statements”) within the meaning of applicable Canadian legislation. Forward-looking statements are typically identified by words such as: “believes”, “expects”, “anticipates”, “intends”, “estimates”, “plans”, “may”, “should”, “would”, “will”, “potential”, “scheduled” or variations of such words and phrases and similar expressions, which, by their nature, refer to future events or results that may, could, would, might or will occur or be taken or achieved. Accordingly, all statements in this news release that are not purely historical are forward-looking statements and include statements regarding beliefs, plans, expectations and orientations regarding the future including, without limitation, any statements or plans regard the geological prospects of the Company’s properties and the future exploration endeavors of the Company. Although the Company believes the expectations expressed in such forward-looking statements are based on reasonable assumptions, such statements are not guarantees of future performance and actual results or developments may differ materially from those in the forward-looking statements. Forward-looking statements are based on a number of material factors and assumptions.

Forward-looking statements involve known and unknown risks, uncertainties and other factors that may cause actual results to differ materially from those anticipated in such forward-looking statements. The forward-looking statements in this news release speak only as of the date of this news release or as of the date specified in such statement. Forward-looking statements in this news release include, but are not limited to, drilling results on the Cisco Project and inferences made therefrom, the potential scale of the Cisco Project, the focus of the Company’s current and future exploration and drill programs, the scale, scope and location of future exploration and drilling activities, the Company’s expectations in connection with the projects and exploration programs being met, the Company’s objectives, goals or future plans, statements, exploration results, potential mineralization, the estimation of mineral resources, exploration and mine development plans, timing of the commencement of operations and estimates of market conditions. Factors that could cause actual results to differ materially from those in forward-looking statements include failure to obtain necessary approvals, variations in ore grade or recovery rates, changes in project parameters as plans continue to be refined, unsuccessful exploration results, changes in project parameters as plans continue to be refined, results of future resource estimates, future metal prices, availability of capital and financing on acceptable terms, general economic, market or business conditions, risks associated with regulatory changes, defects in title, availability of personnel, materials and equipment on a timely basis, accidents or equipment breakdowns, uninsured risks, delays in receiving government approvals, unanticipated environmental impacts on operations and costs to remedy same. Readers are cautioned that mineral exploration and development of mines is an inherently risky business and accordingly, the actual events may differ materially from those projected in the forward-looking statements. Additional risk factors are discussed in the section entitled “Risk Factors” in the Company’s Management Discussion and Analysis for its recently completed fiscal period, which is available under Company’s SEDAR profile at www.sedarplus.ca.

Should one or more of these risks or uncertainties materialize, or should assumptions underlying the forward-looking statements prove incorrect, actual results may vary materially from those described herein as intended, planned, anticipated, believed, estimated or expected. Although the Company has attempted to identify important risks, uncertainties and factors which could cause actual results to differ materially, there may be others that cause results not to be as anticipated, estimated or intended. The Company does not intend, and does not assume any obligation, to update this forward-looking information except as otherwise required by applicable law.

Neither the TSX Venture Exchange nor its Regulation Services Provider (as that term is defined in the policies of the TSX Venture Exchange) accepts responsibility for the adequacy or accuracy of this release.

SOURCE: Q2 Metals Corp.

Energy Savings Projects with Singapore Bank to Scale

Graphene Manufacturing Group Ltd. (TSXV: GMG) (“GMG” or the “Company”) is pleased to announce that GMG, C&W Services Singapore and ACMES, GMG’s Singapore Thermal-XR distributor, have successfully completed energy savings case studies with a Singapore bank. The energy savings was seen on average between 10% to 20%. Following the successful case study, the bank is now exploring the potential to scale the application of Thermal-XR Enhance across more branches.

Figure 1 shows ~33% energy saving by comparing post coating average daily energy consumption to before washing.


Figure 1: Daily Energy Consumption Reduction due to Thermal XR Coating (after washing) on Bank Air Conditioner

To view an enhanced version of this graphic, please visit:
https://images.newsfilecorp.com/files/8082/244317_0264293a642e5ab7_002full.jpg

GMG’s Managing Director and CEO, Craig Nicol, commented: “Our partnership with C&W Services and ACMES has been very successful thus far and we look forward to implementing more energy savings projects with THERMAL-XR® Powered by GMG Graphene with various other companies in Singapore and around the world.”

About GMG:
GMG is an Australian based clean-technology company which develops, makes and sells energy saving and energy storage solutions, enabled by graphene manufactured via in house production process. GMG uses its own proprietary production process to decompose natural gas (i.e. methane) into its natural elements, carbon (as graphene), hydrogen and some residual hydrocarbon gases. This process produces high quality, low cost, scalable, ‘tuneable’ and low/no contaminant graphene suitable for use in clean-technology and other applications.

The Company’s present focus is to de-risk and develop commercial scale-up capabilities, and secure market applications. In the energy savings segment, GMG has initially focused on graphene enhanced heating, ventilation and air conditioning (“HVAC-R”) coating (or energy-saving coating) which is now being marketed into other applications including electronic heat sinks, industrial process plants and data centres. Another product GMG has developed is the graphene lubricant additive focused on saving liquid fuels initially for diesel engines.

In the energy storage segment, GMG and the University of Queensland are working collaboratively with financial support from the Australian Government to progress R&D and commercialization of graphene aluminium-ion batteries (“G+AI Batteries”). GMG has also developed a graphene additive slurry that is aimed to improve the performance of lithium-ion batteries.

GMG’s 4 critical business objectives are:

  1. Produce Graphene and improve/scale cell production processes
  2. Build Revenue from Energy Savings Products
  3. Develop Next-Generation Battery
  4. Develop Supply Chain, Partners & Project Execution Capability

For further information please contact:

  • Craig Nicol, Chief Executive Officer & Managing Director of the Company at craig.nicol@graphenemg.com, +61 415 445 223
  • Leo Karabelas at Focus Communications Investor Relations, leo@fcir.ca, +1 647 689 6041

Neither the TSX Venture Exchange nor its Regulation Services Provider (as that term is defined in the policies of the TSX Venture Exchange) accept responsibility for the adequacy or accuracy of this news release.

Cautionary Note Regarding Forward-Looking Statements

This news release includes certain statements and information that may constitute forward-looking information within the meaning of applicable Canadian securities laws. Forward-looking statements relate to future events or future performance and reflect the expectations or beliefs of management of the Company regarding future events. Generally, forward-looking statements and information can be identified by the use of forward-looking terminology such as “intends”, “expects” or “anticipates”, or variations of such words and phrases or statements that certain actions, events or results “may”, “could”, “should”, “would” or will “potentially” or “likely” occur. This information and these statements, referred to herein as “forward‐looking statements”, are not historical facts, are made as of the date of this news release and include without limitation, statements regarding the bank chain applying Thermal-XR Enhance to all of its remaining branches, GMG’s continued partnership with C&W and the potential application of Thermal-XR Enhance to other companies around the world.

Such forward-looking statements are based on a number of assumptions of management, including, without limitation, that the bank chain will apply Thermal-XR Enhance to all of its remaining branches and that GMG and C&W will implement energy savings case studies with other companies in Singapore and worldwide. Additionally, forward-looking information involves a variety of known and unknown risks, uncertainties and other factors which may cause the actual plans, intentions, activities, results, performance or achievements of GMG to be materially different from any future plans, intentions, activities, results, performance or achievements expressed or implied by such forward-looking statements. Such risks include, without limitation, that the bank chain will not apply Thermal-XR Enhance to all of its remaining branches and that GMG and C&W will not be able to implement energy savings case studies with other companies in Singapore and worldwide.

Although management of the Company has attempted to identify important factors that could cause actual results to differ materially from those contained in forward-looking statements or forward-looking information, there may be other factors that cause results not to be as anticipated, estimated or intended. There can be no assurance that such statements will prove to be accurate, as actual results and future events could differ materially from those anticipated in such statements. Accordingly, readers should not place undue reliance on forward-looking statements and forward-looking information. Readers are cautioned that reliance on such information may not be appropriate for other purposes. The Company does not undertake to update any forward-looking statement, forward-looking information or financial out-look that are incorporated by reference herein, except in accordance with applicable securities laws. We seek safe harbor.

Corporate Logo

To view the source version of this press release, please visit https://www.newsfilecorp.com/release/244317

Doubleview Gold Corp Announces Collaboration with Her Excellency Sheikha Sara Nasser Al-Thani CEO of Qmission W.L.L. Qatar

Doubleview Gold Corp. (TSXV: DBG) (OTCQB: DBLVF) (FSE: 1D4) (the “Company” or “Doubleview”) is pleased to announce that it has received a Statement of Interest from Her Excellency Sheikha Sara Nasser Al-Thani CEO of Qmission W.L.L. for the Company’s Polymetallic HAT Porphyry Deposit, located in northwestern British Columbia, Canada. Her Excellency and Doubleview have entered into an Emissary Agreement to build and foster a potential collaboration with the State of Qatar by way of the Qatar Investment Authority (“QIA”) as well as other Arab countries who are seeking to expand business relations, particularly investments in unique and critical mineral deposits that can deliver the resources needed for a sustainable future. Sheikha Sara Nasser Al-Thani is personally involved in seeking business opportunities and building strategic collaborations between different business sectors through her company Qmission that will benefit all parties involved.

The Middle Eastern country of Qatar is known for its wealth of natural resources, mainly natural gas (LNG) and oil. In 2005, the Qatar Investment Authority (“QIA”) was established. It is the nation’s sovereign wealth fund, renowned for its focus on exceptional, one-of-a-kind investments spanning all major global markets, asset classes, sectors and geographies. Her Excellency noted, “This opportunity extends beyond the oil and gas sector and holds significant potential benefits for Qatar. QMISSION’s focus is to explore diverse sectors, continuously seeking avenues for growth and innovation. Inspired by the words from the Emir of Qatar, His Royal Highness Sheikh Tamim bin Hamad Al Thani, ‘Qatar deserves the best from its citizens,’ we remain committed to identifying groundbreaking prospects. Doubleview Gold and its HAT Deposit, with its abundance of copper, gold, cobalt and scandium, represents a golden opportunity in the mining industry.”

Farshad Shirvani, president & CEO states: “QIA’s vision corresponds perfectly with the Hat Project’s potential significance on the global stage, due to the deposit’s unique variety of critical minerals – copper, cobalt and scandium, in addition to gold and silver – and its size, which sets it apart. This presents a unique investment opportunity. I am honored to have Her Excellency Sheikha Sara Nasser Al Thani as an ally in our mission to develop this deposit and to share my vision with her.”

The Hat Project features a significant and unique combination of critical metals, including scandium, copper, and gold, among other valuable resources. The Hat Deposit’s 2024 maiden resource estimate (“HAT MRE 1.0”) reported the following commodities in both indicated and inferred categories, at a cut-off grade of 0.2% copper equivalent (“CuEq”*):

  • Gold: 929k ounces (indicated), 2.328 million ounces (inferred)
  • Copper: 733 million pounds (indicated), 1.945 billion pounds (inferred)
  • Silver: 2.045 million ounces (indicated), 7.575 million ounces (inferred)
  • Cobalt: 28 million pounds (indicated), 91 million pounds (inferred)
  • Scandium: The scandium potential for the Hat Deposit is estimated to be 300 to 500 million tonnes at an average grade of 40 ppm (0.004%) Sc2O3.

Note: For further details, please refer to the Company’s July 25, 2024, news release.

An update to the Company’s Maiden Resource Estimate (“HAT MRE 2.0”) is expected to be published in Q2, 2025. It will include more than 10,000 meters of additional drill hole information and will be used as part of the Preliminary Economic Assessment (“HAT PEA”) concurrently being completed. Updated Scandium metallurgy studies are underway which will be included in the HAT MRE 2.0 and HAT PEA once concluded.

* – Copper Equivalent (CuEq) currently does not include the Scandium.
– Metal equivalents should not be relied upon for future evaluations.
– Parameters used to calculate Copper Equivalent: Au price (US$/oz): 1900; Ag price (US$/oz): 24; Cu price (US$/lb): 4; Co price (US$/lb): 22. Au recovery: 89.0%; Ag recovery: 68.0%; Cu recovery: 84.0%; Co recovery: 78.0%. * Copper Equivalent Calculation CuEq in % = ([Ag grade in ppm] *24*0.68/31.1035 + [Au grade in ppm] *1900*.89/31.1035 + 0.0001* [Co grade in ppm] *22*0.78*22.0462 + 0.0001* [Cu grade in ppm] *4*0.84*22.0462)/(4*22.0462*0.84).

Doubleview maintains a website at www.doubleview.ca.

Qualified Persons:

Erik Ostensoe, P. Geo., a consulting geologist, and Doubleview’s Qualified Person with respect to the Hat Project as defined by National Instrument 43-101 Standards of Disclosure for Mineral Projects, has reviewed, and approved the technical contents of this news release. He is not independent of Doubleview as he is a shareholder in the company.

About Doubleview Gold Corp

A mineral resource exploration and development company is headquartered in Vancouver, British Columbia, Canada. It is publicly traded on the TSX-Venture Exchange (TSXV: DBG), (OTCQB: DBLVF), (WKN: LA1W038), and (FSE: 1D4). Doubleview focuses on identifying, acquiring, and financing precious and base metal exploration projects across North America, with a strong emphasis on British Columbia. The company enhances shareholder value through the acquisition and exploration of high-quality gold, copper, cobalt, scandium, and silver projects-collectively critical minerals-utilizing cutting-edge exploration techniques.

Doubleview’s success is deeply rooted in the unwavering support of its long-term shareholders, supporters, and institutional investors. Their ongoing commitment has been instrumental in advancing the company’s strategic initiatives. Doubleview looks forward to further collaborative growth and development, and continues to welcome active participation from its valued stakeholders as the company expands its portfolio and strengthens its position in the critical minerals sector.

About the Hat Polymetallic Deposit

The Hat Deposit, located in northwestern British Columbia, is a polymetallic porphyry project with major resources of copper, gold, cobalt, and the potential for scandium. As one of the region’s significant sources of critical minerals, the Hat deposit has undergone targeted exploration and development. The 0.2% CuEq cut-off resource estimate, as of the recently completed Mineral Resource Estimate and the Company’s July 25, 2024, news release, is summarized below:

   Average GradeMetal Content
Open Pit Model HatResource CategoryTonnageCuEqCuCoAuAgCuEqCuCoAuAg
Mt%%%g/tg/tmillion lbmillion lbmillion lbthousand ozthousand oz
In PitIndicated1500.4080.2210.0080.190.421,353733289292,045
Inferred4770.3440.1850.0090.150.493,6191,945912,3287,575

Scandium potential for the Hat Deposit is estimated to be 300 to 500 million tonnes at an average grade of 40 ppm (0.004%) Sc2O3.

For further details, please refer to the Company’s July 25, 2024 news release.

On behalf of the Board of Directors,

Farshad Shirvani, President & Chief Executive Officer

For further information please contact:

Doubleview Gold Corp
Vancouver, BC Farshad Shirvani
President & CEO

T: (604) 678-9587
E: corporate@doubleview.ca

NEITHER TSX VENTURE EXCHANGE NOR ITS REGULATION SERVICES PROVIDER (AS THAT TERM IS DEFINED IN THE POLICIES OF THE TSX VENTURE EXCHANGE) ACCEPTS RESPONSIBILITY FOR THE ADEQUACY OR ACCURACY OF THIS RELEASE.

Certain of the statements made and information contained herein may constitute “forward-looking information.” In particular references to the private placement and future work programs or expectations on the quality or results of such work programs are subject to risks associated with operations on the property, exploration activity generally, equipment limitations and availability, as well as other risks that we may not be currently aware of. Accordingly, readers are advised not to place undue reliance on forward-looking information. Except as required under applicable securities legislation, the Company undertakes no obligation to publicly update or revise forward-looking information, whether as a result of new information, future events or otherwise.

Corporate Logo

To view the source version of this press release, please visit https://www.newsfilecorp.com/release/243263

Global Advanced Metals Declared Conformant to Minerals Due Diligence Audit Standard for 15 Consecutive Years

Global Advanced Metals Pty Ltd (GAM), a leading producer of tantalum and tin products, has successfully undergone conflict minerals due diligence audits by the Responsible Minerals Assurance Process (RMAP) of the Responsible Minerals Initiative (RMI) at its 3 manufacturing sites in Australia, Japan and the United States.

Global_Advanced_Metals_logo.jpg
Global Advanced Metals Logo

GAM has achieved another milestone in the furtherance of its leadership role in due diligence and responsible minerals trade: following August and September 2024 audits, RMAP-RMI has determined GAM’s Aizu, Japan, Greenbushes WA, Australia and Boyertown-Pennsylvania, USA facilities conformant to its audit standards for tantalum and tin.

To earn RMAP-RMI conformance status, a company must successfully undergo a rigorous third party audit of its smelting operations. The audit includes validating evidence of: adherence to the 5-steps Due Diligence Guidance of the Organization for Economic Cooperation and Development (OECD), acceptable reasonable country of origin evaluation, mine of origin and chain of custody documentation, and verification of scrap sources among other criteria.

“These successful audits are additional evidence of the effectiveness of GAM’s holistic management system approach to minerals due diligence across the company. GAM will continue collaborating and partnering with organizations like the Public Private Alliance for Responsible Minerals Trade (PPA), the Responsible Minerals Initiative (RMI), and the Organization for Economic Cooperation and Development (OECD) Multi-Stakeholders Group to drive for responsible business practice in the minerals sector.” Said Edward Steckel, GAM Senior Director of Global Supply Chain.

The RMI-RMAP’s conflict-minerals due diligence audit program is led and supported by a cross section of industries (e.g., Electronics, Aerospace, and Automotive), governments, and other stakeholders. Downstream companies rely on the conformance of smelters like GAM to comply with Section 1502 of the US Dodd-Frank Act, EU conflict minerals regulations, and other applicable conflict-free minerals’ regulations.

About GAM
GAM is a leading conflict-free tantalum and tin products maker. GAM has exclusive rights to the world’s largest industrial resources of tantalum ore located in Western Australia. GAM produces conflict-free tantalum powders and metallurgical products at its Pennsylvania, USA and Aizu, Japan plants for a range of industries including electronics, aerospace, automotive, medical and chemical processing. GAM also produces tin ingot at its site in Greenbushes, WA Australia.

GAM’s smelting facilities in Japan and the USA were first declared “Conflict-Free” in 2010 under the former EICC/GeSI Conflict-Free Sourcing Initiative (CFSI) audit program and continue to maintain their conformance to the current RMAP standard.

About RBA, RMI and RMAP
The Responsible Business Alliance-RBA was formerly known as the Electronic Industry Citizenship Coalition-EICC,The Responsible Minerals Initiative (RMI) was formerly known as the Conflict Free Sourcing Initiative-CFSI, andThe Responsible Minerals Assurance Process-RMAP was formerly known as the Conflict Free Smelter Program-CFSP.

Contact Information
Jean-Paul Meutcheho
Direstor of Sourcing and Corporate Sustainability
jmeutcheho@globaladvancedmetals.com
+1 610-369-8165

SOURCE: Global Advanced Metals

GMG’s Graphene Aluminium-Ion Battery: Collaboration with World Leading USA Battery Innovation Centre and Next Steps Toward Commercialisation

Graphene Manufacturing Group Ltd. (TSXV: GMG) (OTCQX: GMGMF) (“GMG” or the “Company“) is pleased to provide the latest progress update on the Graphene Aluminium-Ion Battery technology (“G+AI Battery“) being developed by GMG and the University of Queensland (“UQ“) under a Joint Development Agreement with Rio Tinto, one of the world’s largest metals and mining groups.

Notably, this update includes information about GMG’s G+AI Battery regarding:

  • Scaling with the Battery Innovation Center of Indiana, United States.
  • Electrochemistry Optimisation
  • 1000 mAh Battery Cell Capacity Reached (Previously)
  • Battery Technology Readiness Level
  • Next Steps Toward Commercialisation and Market Applications
  • Next Generation Battery Performance
  • Important Milestones for GMG’s Graphene Aluminium-Ion Battery Development

Scaling with the Battery Innovation Center of Indiana, United States.

GMG is pleased to announce that it has signed a service contract with the Battery Innovation Center of Indiana (“BIC”) in the United States of America to support the next phase of development of the Graphene Aluminium-Ion Battery.

Cannot view this image? Visit: https://images.newsfilecorp.com/files/8082/243059_e0db247a7453eaf3_001full.jpg

Image 1

To view an enhanced version of this graphic, please visit:
https://images.newsfilecorp.com/files/8082/243059_e0db247a7453eaf3_001full.jpg

BIC is a collaborative initiative designed to incorporate leadership from renowned universities, government agencies, and commercial enterprises. BIC is a public-private partnership and a not-for-profit organization focusing on the rapid development, testing and commercialization of safe, reliable and lightweight energy storage systems for defense and commercial customers. BIC is a unique organization that has been leading battery cell development for world leading battery companies for over 10 years and has carried out over 500 battery development projects.

Cannot view this image? Visit: https://images.newsfilecorp.com/files/8082/243059_e0db247a7453eaf3_002.jpg

Image 2: BIC building in Indiana, USA

To view an enhanced version of this graphic, please visit:
https://images.newsfilecorp.com/files/8082/243059_e0db247a7453eaf3_002full.jpg

BIC’s mission is to accelerate innovation in the field of battery technology by providing access to the entire spectrum of R&D to commercialization, including low volume production, in a single 40,000 square foot facility, located in Newberry, an hour south of Bloomington, Indiana. Under one roof and with virtual connections to the research and manufacturing facilities of its partners, BIC has capabilities in all aspects of the battery life cycle.

Cannot view this image? Visit: https://images.newsfilecorp.com/files/8082/243059_e0db247a7453eaf3_003.jpg

Image 3: One of the BIC dry rooms including electrode coating equipment

To view an enhanced version of this graphic, please visit:
https://images.newsfilecorp.com/files/8082/243059_e0db247a7453eaf3_003full.jpg

By collaborating with BIC, GMG can take advantage of BIC’s technological capabilities and manufacturing facilities and avoid the capital cost of building a pilot plant, that can cost more than AU$10 million dollars, to produce sample cells in advance of mass production. Under its service agreement with BIC, GMG will pay for services rendered and retain all intellectual property of the development work. The service agreement with BIC will enable GMG to optimize BIC’s cell design and battery manufacturing equipment during its scale up of battery production, thereby delaying capital expenditures for manufacturing capacity until battery development is further derisked.

GMG is very pleased to work with BIC on this next phase in the development of GMG’s next generation battery.

Electrochemistry Optimisation

The Company is currently optimising the G+AI Battery pouch cell electrochemistry – which is a standard battery development process step (please see Battery Technology Readiness Level section below).

The Company has developed significant knowledge regarding the electrochemistry of the pouch cells since achieving the targeted 1 Ah cell capacity in February 2024.

The challenges faced by the G+AI Battery during this phase of its maturation are very similar to other battery chemistries that have been developed into mass production – including Lithium-Ion batteries.

The performance of the pouch cells will be communicated upon successfully producing a repeatable and 3rd party tested 1000 mAh+ battery pouch cell.

The Company is confident it can meet its overall timeline on the battery cell roadmap as seen in Figure 1 and as previously communicated.

Cannot view this image? Visit: https://images.newsfilecorp.com/files/8082/243059_e0db247a7453eaf3_004.jpg

Figure 1: Battery Cell Roadmap

To view an enhanced version of this graphic, please visit:
https://images.newsfilecorp.com/files/8082/243059_e0db247a7453eaf3_004full.jpg

There are five steps in this optimisation process which the Company completes once per week in what it calls a “Sprint” as seen in Figure 2.

Cannot view this image? Visit: https://images.newsfilecorp.com/files/8082/243059_gmg_figure2.jpg

Figure 2: Optimisation Weekly Sprint Process

To view an enhanced version of this graphic, please visit:
https://images.newsfilecorp.com/files/8082/243059_gmg_figure2.jpg

  1. Make Cell
    The major components of the G+AI Battery are seen below in Figure 3:
    Cathode: Graphene, binder and solvent (water or another solution) layered on a metal foil cathode substrate.
    Anode: Aluminium foil
    Electrolyte: Aluminium Chloride and ionic fluid (Urea or another solution)
    Separator: Separator
Cannot view this image? Visit: https://images.newsfilecorp.com/files/8082/243059_e0db247a7453eaf3_006.jpg

Figure 3: Graphene Aluminium Ion Battery Components

To view an enhanced version of this graphic, please visit:
https://images.newsfilecorp.com/files/8082/243059_e0db247a7453eaf3_006full.jpg

These are assembled in a standard step by step process – which is documented in the Company’s operation manual of procedures for the Battery Development Process.

There are many different variations that can be trialled in a cell design which can include, but are not limited to, the following as seen in Figure 4:

  • Anode foil types and thicknesses
  • Improving cycle life
  • Cell assembly processes
  • Processing of the graphene for the Cathode Slurry
  • Coating of the Cathode Slurry
  • Variations in the Electrolyte
  • Charging and Discharging algorithms
  • Optimise nominal voltage and capacity
  • Types of Separators (different materials, suppliers and thicknesses)
  • Optimising of the weight of the materials
Cannot view this image? Visit: https://images.newsfilecorp.com/files/8082/243059_gmg_figure4_550.jpg

Figure 4: Cell Optimisation Variables

To view an enhanced version of this graphic, please visit:
https://images.newsfilecorp.com/files/8082/243059_gmg_figure4_550.jpg

Typically, 5 of each battery design is made which ensures a statistical depth to the testing.

A total of 250 individual scientific experiments in pouch cells and near 1000 individual pouch cells were made from 2023 till the present date. The basic modelling of the battery is complete and the Company is now working on dynamic modelling of the battery to support multi variant optimization analysis.

  1. Test Cell Performance
    Once the Cell Performance is measured (on the charging/discharging stacks) there are certain performance parameters that are observed which include, but are not limited to, the following:
    – Capacity (mAh)
    – Nominal Voltage (Volts)
    – Number of Charging and Discharging Cycles (number)
    – Physical expansion or contraction of the cell
    – Physical changes to the cell

This data is then recorded and linked to the cell design and assembly process used to make the cell.

  1. Compare Cell Performance
    The objective of this step is to understand what design and cell assembly parameters, in an isolated test, have a repeatable causal change in cell performance.

Each Sprint usually focuses on a single variable in design or cell assembly – an example of a 3-week Sprint program is seen in Figure 5.

Cannot view this image? Visit: https://images.newsfilecorp.com/files/8082/243059_gmg_figure5.jpg

Figure 5: Sprint Program Example

To view an enhanced version of this graphic, please visit:
https://images.newsfilecorp.com/files/8082/243059_gmg_figure5.jpg

  1. Review Optimisation Options
    Upon reviewing optimisation options for the next Sprint, there are many parameters to consider. Often one design parameter of the cell or assembly process will positively improve one cell performance outcome but have a negative impact on another. As the Company optimises various performance outcomes of the battery cell – some of which are shown in Figure 6 – the Company needs to consider the various potential trade-offs on other performance outcomes.
Cannot view this image? Visit: https://images.newsfilecorp.com/files/8082/243059_gmg_figure6.jpg

Figure 6: Battery Optimisation Process

To view an enhanced version of this graphic, please visit:
https://images.newsfilecorp.com/files/8082/243059_gmg_figure6.jpg

  1. Propose Next Cell Design (repeat Step 1 again)
    Once the Company has selected the design of the Cell parameters, it needs to test for optimisation. This involves repeating step 1 until a final design or variable is chosen.

Read more: https://www.acnnewswire.com/press-release/english/96636/

LaFleur Minerals to Restart Gold Milling at Beacon Gold Mill in Val-d’Or, Quebec

Acquires Mineral Claims Contiguous to the Swanson Gold Project, Québec

LaFleur Minerals Inc. (CSE: LFLR) (OTCQB: LFLRF) (FSE: 3WK0) (“LaFleur Minerals” or the “Company“) is pleased to provide an update on its plans to restart production activities at its 100%-owned Beacon Gold Mill in Val-d’Or, Québec, Canada (Figure 1 and Figure 2). The Beacon Gold Mill is located in a highly prospective mining region for gold exploration on the mineral-rich greenstone Abitibi Belt, an area with over 100 historical and currently operating mines.

BEACON GOLD MILL IS FULLY PERMITTED

The entirely refurbished Beacon Gold Mill was last fully operational in early 2023 when the price of gold was USD$1,800 per ounce and has been under care and maintenance since that time. As gold approaches a record price of USD$3,000 per ounce, the goal of restarting the Beacon Gold Mill in the coming months is an exceptional opportunity for LaFleur Minerals to also target the custom milling of mineralized material from nearby gold deposits that surround the Beacon Mill. LaFleur Minerals demonstrates significant upside potential by ultimately generating revenue at the current elevated gold prices, with the restart of the Beacon Mill targeting a potential annual production scenario of approximately 30,000 to 40,000 ounces of gold based on the current mill capacity. The Company is currently finalizing the restart costs for the Beacon Mill and expects to have all permits and updates completed by the end of Q2 2025.

The entire LaFleur Minerals team has been collectively working toward a successful restart of the Beacon Mill. With the current increase in the price of gold and the fully-permitted Beacon Mill that lies within the prolific Abitibi Gold Belt in the Tier 1 mining district of Val-d’Or, Québec, LaFleur Minerals has a great opportunity to eventually produce gold at Beacon with gold prices at record levels. LaFleur Minerals is now approaching the finish line on many of the fundamental pieces that support this goal including assessing nearby advanced gold deposits and initiating discussions with neighbouring mining companies that could utilize the Beacon Mill to process their bulk samples and future mineralized material through a custom milling agreement for numerous gold deposits in the Val-d’Or region surrounding the Beacon Mill (Figure 3).

Paul Ténière, CEO of LaFleur Minerals, stated, “We continue to make great progress in achieving key operational readiness milestones at the Beacon Mill, including ongoing inspections of all equipment and systems and ensuring an adequate supply of spare parts. The highly experienced team at ABF Mines has been diligently working to finalize a detailed plan and the cost to restart the mill with results expected within the next few weeks. We also continue to meet our environmental monitoring and sampling requirements under our permit to operate, which includes completion of fish and wildlife studies within the tailings storage facility (TSF) as required under both provincial and federal environmental regulations. Our consultants are also working with us to evaluate required upgrades to the TSF as we move towards restarting production at the Beacon Mill.”

Please find video with Lafleur Minerals Beacon Mill Update here: https://lafleurminerals.com/

SWANSON GOLD PROJECT UPDATE

The Swanson gold project is over 15,000 hectares in size and includes several prospects rich in gold and critical metals previously held by Monarch Mining, Abcourt Mines and Globex Mining. The consolidated Swanson Gold Project covers a major structural break that hosts the Swanson, Bartec, and Jolin gold targets and numerous other showings which make up the Swanson gold project. The Swanson gold project is easily accessible by road with a rail line running through the property, allowing direct access to several nearby gold mills and further enhancing its development potential. The Swanson gold project has had in excess of 36,000m of drilling.

  • The Swanson Gold Deposit hosts:
    • Indicated Mineral Resource:
      • 2,113,000 t with an average grade of 1.8 g/t gold, containing 123,400 oz of gold.
    • Inferred Mineral Resource Estimate:
      • 872,000 t with an average grade of 2.3 g/t gold, containing 64,500 oz of gold.

(MRE source: NI 43-101 technical report, effective September 17, 2024, filed on the Company’s SEDAR+ profile).

  • The Swanson Gold Project is located within 50 km of the Company’s fully-permittedBeacon Gold Mill, and includes:
    • mining lease which can be permitted for bulk sampling and future mining scenario.
    • Jolin target (Au): Historical Mineral Resource Estimate
      (source: GESTIM -1996, GM62629 – historical estimate not compliant with NI 43-101)
  • Bartec target (Au): Historical Mineral Resource Estimate.
    (source: GESTIM – DV 87-01 – historical estimate not compliant NI 43-101)

Recent Exploration Activities:

  • High-resolution airborne magnetics and VLF-EM geophysics program:
    • Completed over the entire Swanson Gold Deposit.
  • Oriented soil geochemistry and prospecting program:
    • Conducted by IOS Géosciences (IOS), with final assay results pending.
  • Induced Polarization (IP) – Resistivity Ground Geophysics Survey:
    • A total of 166 line-km will be surveyed in February 2025 at 200 m line spacings.
    • This will cover the Swanson, Bartec, and Jolin deposits, all of which are advanced gold targets with current and historical mineral resources.
  • LaFleur Minerals is currently working with its consultants to expedite permitting of the Swanson Gold Project with a focus on evaluating its potential to supply mineralized material to the Beacon Gold Mill.
  • LaFleur Minerals is also completing an IP ground geophysics survey on its Swanson Gold Project and is planning an aggressive drilling program for this spring and summer to increase the existing mineral resource for the project including incorporating the Bartec, Jolin, and other gold targets. Other ongoing work includes evaluating the open-pit mining potential of the mining lease at the Swanson gold deposit and planning to advance to a Pre-Feasibility Study and mine permitting.

ACQUIRES ADDITIONAL CLAIMS ADJOINING THE SWANSON GOLD PROJECT

The Company is also pleased to announce that it has entered into a Property Purchase Agreement with third-party arm’s length vendors (the “Vendors“) dated February 28, 2025 (the “Agreement“). Under the terms of the Agreement, the Company is entitled to acquire 100% interest to 17 mining claims covering approximately 699 hectares (the “Claims“) contiguous with the Company’s Swanson Gold Project (“Swanson“) in the Barraute region, north of Val-d’Or, Québec. These Claims are located east of the Swanson gold deposit and mining lease held by LaFleur Minerals.

The acquisition terms for the Claims consists of a cash payment totaling $15,000 and the issuance of 150,000 common shares of the Company to the Vendors within 7 business days of approval of the Agreement by the Canadian Securities Exchange (“CSE“). The common shares issued under the Agreement are subject to a statutory hold period in Canada expiring four (4) months and one day from the closing date.

For further background information on the Beacon Gold Mill and Swanson Gold Project please refer to the Company’s website and recent videos at the following link: https://lafleurminerals.com/valdor.

LAFLEUR MINERALS ATTENDING PDAC CONFERENCE IN TORONTO – MARCH 2 TO 5

Connect with LaFleur Minerals CEO, Paul Ténière, Technical Advisor/Exploration Manager, Louis Martin, and Senior Advisor, Jean LaFleur, March 2 to 5 at the Toronto Metro Convention Centre for a 1-on-1 meeting to discuss the Company’s recent developments and plans moving forward for its Swanson Gold Project and Beacon Gold Mill. Contact info@lafleurminerals.com to book in advance.

Cannot view this image? Visit: https://images.newsfilecorp.com/files/6526/243008_168a97ee14f91aa2_001.jpg

Figure 1: Photo of interior of Beacon Mill currently undergoing detailed inspections for restart

To view an enhanced version of this graphic, please visit:
https://images.newsfilecorp.com/files/6526/243008_168a97ee14f91aa2_001full.jpg

Cannot view this image? Visit: https://images.newsfilecorp.com/files/6526/243008_168a97ee14f91aa2_002.jpg

Figure 2: Photo of exterior of Beacon Mill in Val-d’Or, Québec

To view an enhanced version of this graphic, please visit:
https://images.newsfilecorp.com/files/6526/243008_168a97ee14f91aa2_002full.jpg

Cannot view this image? Visit: https://images.newsfilecorp.com/files/6526/243008_168a97ee14f91aa2_003.jpg

Figure 3: Map of nearby gold deposits within a 50 km radius of the Beacon Gold Mill

To view an enhanced version of this graphic, please visit:
https://images.newsfilecorp.com/files/6526/243008_168a97ee14f91aa2_003full.jpg

Qualified Person Statement

All scientific and technical information in this news release has been prepared and approved by Louis Martin, P.Geo., Technical Advisor to the Company and considered a Qualified Person for the purposes of NI 43-101.

Read more: https://www.acnnewswire.com/press-release/english/96641/

Q2 Metals Announces Warrant Exercise for $7.6 Million

Highlights

  • 12,808,333 warrants issued in the Company’s February 2023 private placement financing have been exercised.
  • Total proceeds of $7,684,999.80 have been received.

Q2 Metals Corp. (TSXV:QTWO)(OTCQB:QUEXF)(FSE:458) (Q2  or the  Company ) is pleased to announce that a total of 12,808,333 share purchase warrants bearing a strike price of $0.60 per share (the “Warrants”) were exercised prior to their expiry date. The Warrants were issued in connection with a private placement financing that closed on February 23, 2023. Total proceeds of $7,684,999.80 was received from the exercised Warrants.

“We are extremely pleased to add the cash proceeds from the exercise of these expiring Warrants to Q2’s strong balance sheet. Our fiscal year-end of February 28 will reflect a cash position of approximately $12.3m. Our fully funded 2025 winter drill campaign at Cisco is underway and we look forward to displaying our core and speaking with investors at a very busy PDAC next week,” said Alicia Milne, President and Chief Executive Officer of Q2 Metals.

Upcoming Events
PDAC Booth and Core Shack
The Company will be attending and exhibiting on site at the 2025 Prospectors & Developers Association of Canada event (“PDAC 2025”) in Toronto, ON.

Q2 is exhibiting in the Investors Exchange from March 2 – 5, 2025 at booth number 2726 and will also be exhibiting core from the Cisco Lithium Project at the PDAC 2025 Core Shack on March 4 – 5, 2025.

For more information on PDAC 2025, please click here.

PDAC Quebec Day: Critical & Strategic: Mining in Québec
Q2 Metals is honoured to have been selected to provide a corporate spotlight presentation during Quebec Day at PDAC. Q2 Metals President and CEO Alicia Milne will present at 10:25am on March 4 th in Room 206D.

For more information on Quebec Day, click here .

About Q2 Metals Corp
Q2 Metals is a Canadian mineral exploration company focused on the Cisco Lithium Project located within the greater Nemaska traditional territory of the Eeyou Istchee Territory, James Bay, Quebec, where drilling is currently underway.

The Cisco Project is comprised of 767 claims, totaling 39,389 hectares. The main mineralized zone is just 6.5 kilometres (“km”) away from the Billy Diamond Highway and transects the Project. The town of Matagami, which features direct rail link to much of James Bay, is approximately 150 km to the south.

Cisco has district-scale potential with an already identified mineralized zone and 2024 discovery drill results that include:

  • 120.3 metres at 1.72% Li 2 O (hole CS-24-010);
  • 215.6 metres at 1.69% Li 2 O (hole CS-24-018);
  • 347.1 metres at 1.35% Li 2 O (hole CS-24-021); and
  • 188.6 metres at 1.56% Li 2 O (hole CS-24-023)

The Cisco Project is situated along the Frotet Evans Greenstone Belt, comprised of a volcanic package dominated by mafic to felsic metavolcanic rocks, of the southern James Bay Lithium District, the same belt that hosts the Sirmac and Moblan lithium deposits, located 130 km and 180 km away, respectively.

FOR FURTHER INFORMATION, PLEASE CONTACT:
Alicia Milne
President & CEO
Alicia@Q2metals.com

Jason McBride
Corporate Communications
Jason@Q2metals.com

Chris Ackerman
Corporate Communications
Chris@Q2metals.com
Telephone: 1 (800) 482-7560
E-mail: info@Q2metals.com

www.Q2Metals.com

Click to follow us online:
XLinkedInFacebook, and Instagram

Qualified Person
Neil McCallum, B.Sc., P.Geol, a registered permit holder with the Ordre des Géologues du Québec and Qualified Person as defined by NI 43-101 (“QP”), has reviewed and approved the technical information in this news release. Mr. McCallum is a director and VP Exploration for Q2.

Forward-Looking Statements
This news release contains forward-looking statements and forward-looking information (collectively, “forward-looking statements”) within the meaning of applicable Canadian legislation. Forward-looking statements are typically identified by words such as: “believes”, “expects”, “anticipates”, “intends”, “estimates”, “plans”, “may”, “should”, “would”, “will”, “potential”, “scheduled” or variations of such words and phrases and similar expressions, which, by their nature, refer to future events or results that may, could, would, might or will occur or be taken or achieved. Accordingly, all statements in this news release that are not purely historical are forward-looking statements and include statements regarding beliefs, plans, expectations and orientations regarding the future including, without limitation, any statements or plans regarding the geological prospects of the Company’s properties and the future exploration endeavors of the Company. Although the Company believes the expectations expressed in such forward-looking statements are based on reasonable assumptions, such statements are not guarantees of future performance and actual results or developments may differ materially from those in the forward-looking statements. Forward-looking statements are based on a number of material factors and assumptions.

Forward-looking statements involve known and unknown risks, uncertainties and other factors that may cause actual results to differ materially from those anticipated in such forward-looking statements. The forward-looking statements in this news release speak only as of the date of this news release or as of the date specified in such statement. Forward looking statements in this news release include, but are not limited to, the focus of the Company’s current and future exploration and drill programs, the scale, scope and location of future exploration and drilling activities, the Company’s expectations in connection with the projects and exploration programs being met, the Company’s objectives, goals or future plans, statements, exploration results, potential mineralization, the estimation of mineral resources, exploration and mine development plans, timing of the commencement of operations and estimates of market conditions. Factors that could cause actual results to differ materially from those in forward-looking statements include failure to obtain necessary approvals, variations in ore grade or recovery rates, changes in project parameters as plans continue to be refined, unsuccessful exploration results, changes in project parameters as plans continue to be refined, results of future resource estimates, future metal prices, availability of capital and financing on acceptable terms, general economic, market or business conditions, risks associated with regulatory changes, defects in title, availability of personnel, materials and equipment on a timely basis, accidents or equipment breakdowns, uninsured risks, delays in receiving government approvals, unanticipated environmental impacts on operations and costs to remedy same. Readers are cautioned that mineral exploration and development of mines is an inherently risky business and accordingly, the actual events may differ materially from those projected in the forward-looking statements. Additional risk factors are discussed in the section entitled “Risk Factors” in the Company’s Management Discussion and Analysis for its recently completed fiscal period, which is available under Company’s SEDAR profile at www.sedarplus.ca .

Should one or more of these risks or uncertainties materialize, or should assumptions underlying the forward-looking statements prove incorrect, actual results may vary materially from those described herein as intended, planned, anticipated, believed, estimated or expected. Although the Company has attempted to identify important risks, uncertainties and factors which could cause actual results to differ materially, there may be others that cause results not to be as anticipated, estimated or intended. The Company does not intend, and does not assume any obligation, to update this forward-looking information except as otherwise required by applicable law.

Neither the TSX Venture Exchange nor its Regulation Services Provider (as that term is defined in the policies of the TSX Venture Exchange) accepts responsibility for the adequacy or accuracy of this release.

SOURCE: Q2 Metals Corp.

Doubleview Gold Corp Announces Significant High-Grade Copper and Gold Intercepts at Hat Polymetallic Deposit

Doubleview Gold Corp. (TSXV: DBG) (OTCQB: DBLVF) (FSE: 1D4) (the “Company” or “Doubleview”) is pleased to announce significant assay results from its 2024 drilling program at the Hat Polymetallic Deposit in northwestern British Columbia. The results from drill holes H078 and H079 include the most substantial intervals of high-grade copper and gold mineralization encountered at the Hat Project to date. Drill holes H081, H082, H083 and H085 provide more details of the East Lisle Zone, a shallow extension of the Main Lisle Zone. (Drill hole H084 was abandoned before it reached its target depth).

1- Central Lisle Zone Drill Results:

The recent drilling focused on the Central Lisle Zone, which is interpreted as a potential porphyry feeder zone. The intercepts demonstrate shallow mineralization horizons and provide further evidence of the Hat Deposit’s robust mineralization profile.

Drill Hole H078:

  • From 12 meters to 684 meters: 672 meters averaging 0.29% Copper and 0.22 g/t Gold (0.50% CuEq – see note (a) for CuEq calculation).
  • Significant long intercepts include:
    • 409 meters (from 92 meters to 501 meters) averaging 0.39% Copper and 0.28 g/t Gold (0.65% CuEq) including
    • 107 meters (from 247 meters to 354 meters) averaging 1.00% Copper and 0.46 g/t Gold (1.42% CuEq), the highest-grade interval recorded at the Hat Project.

Drill Hole H079:

  • From 7 meters to 732 meters:725 meters averaging 0.29% Copper and 0.22 g/t Gold (0.44% CuEq) including
    • 572 meters (from 150 meters to 722 meters) averaging 0.28% Copper and 0.25 g/t Gold (0.50% CuEq) and
    • 213 meters (from 510 meters to 723 meters) averaging 0.59% Copper and 0.50 g/t Gold (1.00% CuEq) and
    • 82 meters (from 600 meters to 682 meters) averaging 0.95% Copper and 0.79 g/t Gold (1.58% CuEq).

Drill Hole H080:

  • From 318 meters to 372 meters:54 meters averaging 0.30% Copper and 0.21 g/t Gold (0.50% CuEq), including:
    • 22 meters (from 350 meters to 372 meters) averaging 0.54% Copper and 0.38 g/t Gold (0.91% CuEq).

Table 1: Summary of Significant Drill Intercepts

DDHFrom
(m)
To
(m)
Length
(m)
CuEq (%) Excl. Sc2O3Cu 
(%)
Au
(g/t)
Ag
(g/t)
Co
(g/t)
Sc
(g/t)
H078         
 12.0684.0672.00.500.290.220.508528.7
Incl.92.0501.0409.00.650.390.280.6610426.2
Incl.134.0354.0220.01.000.600.441.0513025.6
Incl.247.0354.0107.01.421.000.461.6114124.1
H079         
 7.0732.0725.00.440.230.220.357329.0
Incl.150.0722.0572.00.500.280.250.346828.8
Incl.510.0723.0213.01.000.590.500.697031.2
Incl.600.0722.0122.01.340.790.691.037330.6
Incl.600.0682.082.01.580.950.791.257731.4
H080         
 114.0444.0330.00.280.150.120.168228.3
Incl.225.0279.054.00.500.300.210.219822.3
Incl.225.0247.022.00.910.540.380.3516926.1
Incl.232.0247.015.01.190.720.520.4517124.1

Please note: the intervals presented in this table are not true widths

Central Lisle Zone Drill Results Discussion:

The exceptional grades and intercepts reported from holes H078 and H079 confirm the high-grade nature of the mineralization within the Central Lisle Zone and suggest proximity to the core of the porphyry system, possibly representing the feeder zone. The intercepts display consistent copper, gold and strong cobalt values, as well as consistent scandium mineralization, reinforcing the Hat Deposit’s potential as a significant resource of strategic metals.

Cannot view this image? Visit: https://images.newsfilecorp.com/files/8003/242256_1c3c41839422c817_001.jpg

Figure 1: Section view of Central Lisle Zone based on 2024 Resource Block Model of the MRE with drill holes H078 and H079. [see note (b)]

To view an enhanced version of this graphic, please visit:
https://images.newsfilecorp.com/files/8003/242256_1c3c41839422c817_001full.jpg

President and CEO, Farshad Shirvani, commented:

“These are the most significant drill results we have ever reported from the Hat Project that is attracting attention from major players in the metals industry. The substantial copper and gold grades over considerable lengths indicate that we may be intersecting the core of the porphyry system. These results not only underscore the robust nature of the Hat Deposit but also enhance its potential to become a world-class polymetallic resource. We are excited about the conclusions of these findings and look forward to advancing the project with further drilling and exploration activities.”

2- East Lisle New Horizon:

The East Lisle Zone has revealed a promising new zone of mineralization beyond the conceptual pit shell proposed in MRE V1 [note (b)] and at depth, which is expected to be extended in the upcoming MRE V2 with new conceptual pit walls. All drill holes in this setting intersected strong copper and gold mineralization.

Table 2: Summary of Significant Drill Intercepts from East Lisle Zone

DDHFrom
(m)
To
(m)
Length
(m)
CuEq (%) Excl. Sc2O3Cu 
(%)
Au
(g/t)
Ag
(g/t)
Co
(g/t)
Sc
(g/t)
H081         
 39.0354.0315.00.320.150.180.256127.3
Incl.108.0327.0219.00.400.200.220.297028.0
Incl.108.0229.0121.00.500.230.320.407026.0
Incl.108.0142.234.21.130.500.811.085224.3
Incl.133.8144.010.23.051.521.993.289022.2
H082         
 69.0483.0414.00.330.220.110.396228.2
Incl.152.7477.0324.40.370.260.100.446728.1
Incl.258.0476.0218.00.500.370.130.617528.5
Incl.288.6454.0165.40.600.440.150.768227.7
Incl.347.9463.0115.10.620.500.110.927827.0
Incl.385.0424.039.00.920.750.151.4010326.7
H083         
 115.9327.0211.10.380.200.200.266426.3
Incl.201.0303.6102.60.590.330.310.337928.7
Incl.204.0263.059.00.850.500.410.5010229.3
Incl.229.0263.034.01.290.750.630.7413724.3
Incl.229.0249.020.01.761.030.871.0316024.6
H085         
 42.0454.4412.40.200.110.090.195129.8
Incl.307.0464.0157.00.330.210.120.296231.1
Incl.386.0459.073.00.380.250.130.386533.3
Incl.441.4459.017.70.700.450.280.638727.1
Incl.441.4453.412.00.860.530.370.7810026.8
Note: Dill Hole H084 was abandoned.

Please note: the intervals presented in this table are not true widths

East Lisle Zone Drill Results Discussion:
The results from the East Lisle Zone indicate a significant new zone of mineralization, suggesting potential extensions of the Hat Deposit to the east. The drill intercepts show consistent grades over substantial lengths, underscoring the prospectivity of this area and supporting further exploration.

Cannot view this image? Visit: https://images.newsfilecorp.com/files/8003/242256_1c3c41839422c817_002.jpg

Figure 2: Section view of Central Lisle Zone based on 2024 Resource Block Model of the MRE with drill holes H081, H082, H083, and H085. [see note (b)]

To view an enhanced version of this graphic, please visit:
https://images.newsfilecorp.com/files/8003/242256_1c3c41839422c817_002full.jpg

3- Far Northwest Lisle Zone:

The Far Northwest Lisle Zone has produced encouraging results, revealing multiple intervals of copper, gold, and associated metals. These results suggest significant potential for mineralization in this area, further extending the scope of the Hat Polymetallic Deposit.

Table 3: Summary of Significant Drill Intercepts of the Far Northwest Lisle Zone

DDHFrom
(m)
To
(m)
Length
(m)
CuEq (%) Excl. Sc2O3Cu 
(%)
Au
(g/t)
Ag
(g/t)
Co
(g/t)
Sc
(g/t)
H086         
 78.0151.073.00.340.200.150.356030.4
Incl.96.8150.053.20.420.250.190.425430.5
Incl.104.0145.841.80.500.300.230.495631.3
H087         
 140.3156.015.80.310.240.031.286526.1
Incl.141.8156.014.20.340.270.031.417027.8
H088         
 82.0124.042.00.340.200.101.1811330.2
Incl.96.0124.028.00.430.270.111.6313131.9
Incl.246.0318.072.00.320.200.100.947629.9
Incl.273.0289.016.00.750.500.202.4516726.2
H089         
 117.0204.087.00.180.100.060.585333.7
Incl.316.0324.08.00.350.200.110.7712918.8

Please note: the intervals presented in this table are not true widths

Notes:

(a) Copper Equivalent (CuEq) currently does not include the Scandium

  1. Metal equivalents should not be relied upon for future evaluations. – Drill hole intercepts included in this news release are core lengths that may or may not be true widths of mineralization. It is not possible to determine true widths. –
  2. Parameters used to calculate Copper Equivalent: Au price (US$/oz): 1900; Ag price (US$/oz): 24; Cu price (US$/lb): 4; Co price (US$/lb): 22. Au recovery: 89.0%; Ag recovery: 68.0%; Cu recovery: 84.0%; Co recovery: 78.0%. Copper Equivalent Calculation CuEq in % = ([Ag grade in ppm] *24*0.68/31.1035 + [Au grade in ppm] *1900*.89/31.1035 + 0.0001* [Co grade in ppm] *22*0.78*22.0462 + 0.0001* [Cu grade in ppm] *4*0.84*22.0462)/(4*22.0462*0.84).

(b) For further details, please refer to the Company’s July 25, 2024 news release of the MRE.

(c) Drill holes are projected onto the sections of this news release.

Table 4. Details of Location and direction of drill holes discussed in this release:

DDH IDUTM-East (m)UTM-North (m)Elevation (m)Max-Depth (m)Azimuth (°)Dip (°)
H078347,8656,453,951956.570812075
H079347,8656,453,951956.573212058
H080347,8656,453,951956.56247056
H081348,3486,454,1861,008537088
H082348,3486,454,1861,00855827065
H083348,3486,454,1861,00855231559
H084348,3486,454,1861,008289063
H085348,3486,454,1861,00854326063
H086347,5186,454,43097647134571
H087347,5186,454,430976465087
H088347,7036,454,7491,02539018062
H089347,7036,454,7491,025351062
Cannot view this image? Visit: https://images.newsfilecorp.com/files/8003/242256_1c3c41839422c817_003.jpg

Figure 3: Drill Plan

To view an enhanced version of this graphic, please visit:
https://images.newsfilecorp.com/files/8003/242256_1c3c41839422c817_003full.jpg

Quality Assurance and Quality Control:

Hat Project drill cores are processed at Doubleview’s camp where they are photographed, measured and logged by our technical staff and then divided using a diamond bladed saw. One half is placed in a stout bag to form the assay sample that is forwarded securely to the independent analytical lab. The remaining half core is stored on site where it is available for further examination and sampling. The assay cores are subject to a Chain of Custody routine as they are shipped from camp to a bonded carrier for delivery to the lab.

Core samples are analysed at the North Vancouver facility of ALS Canada Ltd. using their PREP-31, PGM-ICP24, ME-MS61, and ME-ICP06 packages. Each core sample is dried, then crushed to 70% passing a 2mm screen. All material is processed in an automatic Riffle splitter to yield a 250g homogenized, representative sample. This sub-sample is then pulverized to 85% passing a 75-micron screen. All samples are analyzed for Au, Pt, Pd by 50g fire-assay fusion/ICP-ES finish, using PGM-ICP24 package. A separate 0.25g pulp split is analyzed by Four Acid digestion/ICP-MS finish, reporting 48 elements. Over limit elements are analyzed by Ore Grade Four Acid digestion/ICP-ES finish using ME-OG62 assay package. All of Doubleview’s core samples are analyzed or assayed at independent ISO 17025 and ISO 9001- certified laboratories.

When initial assays are received and accepted by our staff, a certain fraction of the samples will be sent to a second ISO-certified lab for check assay and verification purposes. Assays will be reported in News Releases.

Doubleview maintains a website at www.doubleview.ca.

Qualified Persons:

Erik Ostensoe, P. Geo., a consulting geologist, and Doubleview’s Qualified Person with respect to the Hat Project as defined by National Instrument 43-101 Standards of Disclosure for Mineral Projects, has reviewed, and approved the technical contents of this news release. He is not independent of Doubleview as he is a shareholder in the company.

About Doubleview Gold Corp

A mineral resource exploration and development company is headquartered in Vancouver, British Columbia, Canada. It is publicly traded on the TSX-Venture Exchange (TSXV: DBG) (OTCQB: DBLVF) (WKN: LA1W038) and (FSE: 1D4). Doubleview focuses on identifying, acquiring, and financing precious and base metal exploration projects across North America, with a strong emphasis on British Columbia. The company enhances shareholder value through the acquisition and exploration of high-quality gold, copper, cobalt, scandium, and silver projects-collectively critical minerals-utilizing cutting-edge exploration techniques.

Doubleview’s success is deeply rooted in the unwavering support of its long-term shareholders, supporters, and institutional investors. Their ongoing commitment has been instrumental in advancing the company’s strategic initiatives. Doubleview looks forward to further collaborative growth and development, and continues to welcome active participation from its valued stakeholders as the company expands its portfolio and strengthens its position in the critical minerals sector.

About the Hat Polymetallic Deposit

The Hat Deposit, located in northwestern British Columbia, is a polymetallic porphyry project with major resources of copper, gold, cobalt, and the potential for scandium. As one of the region’s significant sources of critical minerals, the Hat deposit has undergone targeted exploration and development. The 0.2% CuEq cut-off resource estimate, as of the recently completed Mineral Resource Estimate and the Company’s July 25, 2024, news release, is summarized below:


Open Pit Model Hat


Resource Category
 Average GradeMetal Content
TonnageCuEqCuCoAuAgCuEqCuCoAuAg
Mt%%%g/tg/tmillion
lb
million lbmillion lbthousand ozthousand oz
In PitIndicated1500.4080.2210.0080.190.421,353733289292,045
Inferred4770.3440.1850.0090.150.493,6191,945912,3287,575

Scandium potential for the Hat Deposit is estimated to be 300 to 500 million tonnes at an average grade of 40 ppm (0.004%) Sc2O3.

For further details of the MRE, please refer to the Company’s July 25, 2024 news release.

On behalf of the Board of Directors,

Farshad Shirvani, President & Chief Executive Officer

For further information please contact:

Doubleview Gold Corp
Vancouver, BC Farshad Shirvani
President & CEO

T: (604) 678-9587
E: corporate@doubleview.ca

NEITHER TSX VENTURE EXCHANGE NOR ITS REGULATION SERVICES PROVIDER (AS THAT TERM IS DEFINED IN THE POLICIES OF THE TSX VENTURE EXCHANGE) ACCEPTS RESPONSIBILITY FOR THE ADEQUACY OR ACCURACY OF THIS RELEASE.

Certain of the statements made and information contained herein may constitute “forward-looking information.” In particular references to the private placement and future work programs or expectations on the quality or results of such work programs are subject to risks associated with operations on the property, exploration activity generally, equipment limitations and availability, as well as other risks that we may not be currently aware of. Accordingly, readers are advised not to place undue reliance on forward-looking information. Except as required under applicable securities legislation, the Company undertakes no obligation to publicly update or revise forward-looking information, whether as a result of new information, future events or otherwise.

Corporate Logo

To view the source version of this press release, please visit https://www.newsfilecorp.com/release/242256

GMG Unveils G(R) Lubricant Engine Performance Testing Results: A Transformative Graphene Energy Saving Solution for the Multi Trillion Dollar Global Liquid Fuel Industry

Graphene Manufacturing Group Ltd. (TSXV: GMG) (OTCQX: GMGMF) (“GMG” or the “Company”) is pleased to announce the results of the multi-year performance testing of G® Lubricant, a transformative graphene liquid concentrate additive designed to enhance the performance of diesel and gasoline (petrol) engines. This product has the potential to reshape the future of the global liquid fuels industry and offers an innovative solution that optimizes efficiency and power for stationary or mobile engines.


To view an enhanced version of this graphic, please visit:
https://images.newsfilecorp.com/files/8082/242057_gmg1.jpg

GMG is in the process of preparing packaging and marketing materials for G® Lubricant, and expects to begin a direct marketing campaign, targeting fleet owners and initially commencing in Australia and then expanding into other markets from April 2025 onwards.

Click here to order a G® Lubricant sample for your own engine testing.

Unleashing the Power of Graphene

G® Lubricant, a graphene liquid concentrate that can be added to any mineral or synthetic oil used in an internal combustion engine, has been shown to increase fuel efficiency by up to 8.4% in a diesel engine. The amount of graphene in the final lubricant once G® Lubricant is mixed in is only ~ 1:10,000, with the balance of the concentrate consisting of lubricating base oil. As a result, G® Lubricant can be used safely in any internal combustion engine. Over the past four years, GMG has conducted environmentally controlled testing of G® Lubricant in internal combustion engines monitored and verified by The University of Queensland. GMG’s test results have been corroborated by similar savings realized by customers over a number of years of field testing.

Figure 1 below shows the high level fuel efficiency improvement provided by the G® Lubricant additive, while Figure 8 provides the detailed fuel testing parameters.

Cannot view this image? Visit: https://images.newsfilecorp.com/files/8082/242057_gmg2.jpg

Figure 1: Diesel Engine Fuel Efficiency Improvement provided by G Lubricant

To view an enhanced version of this graphic, please visit:
https://images.newsfilecorp.com/files/8082/242057_gmg2en.jpg

The data shows a clear increase in fuel efficiency performance from G® Lubricant when the load is increased on the engine. High loads for truck diesel engines are usually seen when the truck starts to move, and then at high speeds when encountering wind resistance. Usually stationary diesel engines for power generation operate at high load.

Figure 2 shows the potential savings for the main types of diesel engine commercial vehicles in use in Australia – with average vehicle data sourced from the Australian Bureau of Statistics[1] (ABS).

Cannot view this image? Visit: https://images.newsfilecorp.com/files/8082/242057_gmg3.jpg

Figure 2: Potential Cost Savings per Vehicle Type provided by G Lubricant

To view an enhanced version of this graphic, please visit:
https://images.newsfilecorp.com/files/8082/242057_gmg3en.jpg

Exceptional Performance Confirmed by University of Queensland

GMG’s Managing Director and CEO, Craig Nicol, commented: “G® Lubricant has taken over 4 years of advanced product testing and is transformational for energy efficiency and emissions reduction for the liquid fuels industry – it is the culmination of decades of lubricants, engines, energy markets and graphene knowledge which is inherent in the GMG business. The next challenge to commercialise this product awaits – which we are eagerly preparing for.”

GMG’s Chairman and Director, Jack Perkowski, commented: “G® Lubricant’s performance, which demonstrates an 8.4% improvement in fuel efficiency using only a very small amount of graphene in an easy to use graphene concentrate, is a ‘Category Creator’ that has the potential to redefine the multi trillion dollar liquid fuels market. The fact that only 1% of G® Lubricant is needed to achieve such savings provides a very attractive value proposition for fleet owners.”

Click here to order a G® Lubricant sample for your own engine testing.

US$ 1.4 Trillion Global Diesel Industry

Whilst G® Lubricant can be used to reduce fuel consumption in both diesel and gasoline/petrol engines GMG intends to focus on the diesel market initially, which is largely B2B focused, and therefore, more targeted as far as fuel cost savings and performance. GMG calculates that global diesel fuel sales totalled US$1.4 Trillion per annum[2] including taxes and duties on approximately 28 million barrels of diesel per day as detailed by the EIA2. Figure 3 shows the top 34 countries in the world with diesel fuel sales greater than US$10 Billion per annum.

Cannot view this image? Visit: https://images.newsfilecorp.com/files/8082/242057_gmg4.jpg

Figure 3: Total Diesel Fuel Sales US$ Billion

To view an enhanced version of this graphic, please visit:
https://images.newsfilecorp.com/files/8082/242057_gmg4en.jpg

Estimated US$ 1.2 Billion Per Annum Global Diesel Market For G® Lubricant

Assuming an average fuel savings of 8.4%, GMG believes that a conservative estimate of the potential market for G® Lubricant is 10% of the fuel savings realized by users annually. Assuming G® Lubricant pricing equal to 10% of the savings realized, GMG estimates that the potential global revenue for G® Lubricant is US$ 1.2 Billion sales per annum. Figure 4 shows GMG’s estimates of potential annual sales of G® Lubricant by country.

Cannot view this image? Visit: https://images.newsfilecorp.com/files/8082/242057_gmg5.jpg

Figure 4: Total G® Lubricant Sales Opportunity

To view an enhanced version of this graphic, please visit:
https://images.newsfilecorp.com/files/8082/242057_gmg5en.jpg

Detailed Equipment and Process for Testing G® Lubricant

The following describes the equipment used and the process followed by the Company in demonstrating the fuel saving demonstration of the G® Lubricant in the diesel engine generator:

  • A 30kVA (24 kW) Cummins diesel engine generator (with 14,784 hours of run time) as seen in Figure 5 and described in Figure 6 was purchased and setup in the GMG Richlands warehouse.
  • The generator was connected to a 40 kW power load bank which consumed the energy produced by the generator and created the load and a 500 litre self-contained fuel tank.
  • Two calibrated flow sensors were connected (inflow and return/outflow) to the fuel lines and to a data logger which recorded the fuel consumption.
  • An Energy Analyzer was used to log and track energy produced by the generator.
  • Tests were conducted on loads of 40%, 60% and 80% loads of the 40 kW power load bank – 12, 18, 24 kw respectively.
  • A baseline to record diesel fuel consumption under normal engine oil and operating conditions was completed with newly changed recommended premium diesel engine oil and a new oil filter. This oil change was carried out by a professional engine maintenance service company.
  • The engine was run at the different loads (40%, 60% and 80%) and the baseline and G® Lubricant data set used for the analytics is when the maximum ambient temperature for the day was less than 33 degrees Celsius and relative humidity was between 50% and 80% with no rain. Fuel consumption for diesel engines changes when operating in rain or very high humidity or temperatures, so the fuel consumption data baseline and G® Lubricant engine oil additive performance testing were excluded for these times.
  • Only steady state data was used and so any variance or anomalous data seen in either baseline or G® Lubricant datasets were removed from the analytics. Data sets were grouped into minute blocks.
  • Once the baseline fuel tests were completed, the engine oil was drained and the oil filters were replaced. G-Lubricant with approximately 1:100 concentration was mixed at approximately 1% ratio by weight with a new batch of the same premium recommended engine oil and added to the generator engine. The end ratio of GMG’s Graphene to the diesel engine oil was approximately 1:10,000 by weight. The oil change was carried out by the same professional engine maintenance service company.

G® Lubricant Packaging

G® Lubricant is currently sold by GMG in different small pack sizes, a 500 ml pack is shown in Figure 5 which can be diluted into 50 litres of engine oil to provide improved engine performance. GMG intends to direct market the product to its targeted markets through various pack sizes for direct and bulk use.

Cannot view this image? Visit: https://images.newsfilecorp.com/files/8082/242057_gmg7.jpg

Figure 5: G® Lubricant 500 ml pack (which can be used to dose 50 litres of engine oil)

To view an enhanced version of this graphic, please visit:
https://images.newsfilecorp.com/files/8082/242057_gmg7en.jpg

Click here to order a G® Lubricant sample for your own engine testing.

Cannot view this image? Visit: https://images.newsfilecorp.com/files/8082/242057_7719c67484409aad_011full.jpg

Figure 6: Diesel Engine Generator Equipment

To view an enhanced version of this graphic, please visit:
https://images.newsfilecorp.com/files/8082/242057_7719c67484409aad_011full.jpg

Cannot view this image? Visit: https://images.newsfilecorp.com/files/8082/242057_gmg8.jpg

Figure 7: Diesel Engine Generator Equipment Parameters.

To view an enhanced version of this graphic, please visit:
https://images.newsfilecorp.com/files/8082/242057_gmg8en.jpg

The detailed data for this fuel test is shown below in Figure 8

LoadEngine Oil UsedNo of Data PointsFuel Used (litre per hour)Power Output (kWh)Fuel Efficiency 
(kWh per litre)
% Fuel Efficiency Increase from G® Lubricant
40% LoadPremium Diesel Engine Oil (PDEO)107370Mean: 211.95Average:3.03  
Standard
Deviation: 
 0.60Standard
Deviation:
0.01
Min: 210.31Min:  3.00
Max:  214.49Max:  3.06
 PDEO +
G® Lubricant
136766.7Average:  211.84Average:  3.184.9%
Standard
Deviation:
 0.68Standard
Deviation:
 0.24
Min: 209.89Min: 2.64
Max:  213.45Max:  3.56
60% LoadPremium Diesel Engine Oil (PDEO)41890Average:  297.13Average:  3.30 
Standard
Deviation:
 0.65Standard
Deviation:
 0.01
Min: 295.06Min:3.28 
Max:  298.42Max:  3.32
 PDEO +
G® Lubricant
148684.9Average:  301.31Average:  3.557.5%
Standard
Deviation:
 7.62Standard
Deviation:
 0.20
Min: 294.13Min: 3.27
Max:  313.85Max:  4.22
80% LoadPremium Diesel Engine Oil (PDEO)811120Average:  404.52Average:  3.37 
Standard
Deviation:
 0.79Standard
Deviation:
 0.01
Min: 402.62Min: 3.36
Max:  406.20Max:  3.38
 PDEO +
G® Lubricant
1756110.6Average:  404.21Average:  3.658.4%
Standard
Deviation:
 1.26Standard
Deviation:
 0.13
Min: 401.30Min: 3.34
Max:  407.37Max:  4.49

Figure 8: Detailed Diesel Engine Generator Performance Data.

Basis for Performance Improvement

As seen in Figure 9, G® Lubricant GMG improves fuel efficiency by creating less friction in the boundary layer lubrication of the pistons inside the cylinder block of the engine. It is widely accepted that approximately 30% of the fuel is used in an engine to overcome internal friction, and that approximately 60% of the engine friction is in the piston area. Graphene has also been seen to prevent wear and also fill in wear scars of an engine, helping to improve piston sealing.

Cannot view this image? Visit: https://images.newsfilecorp.com/files/8082/242057_gmg9.jpg

Figure 9: G® Lubricant is believed to reduce friction in the engine pistons.

To view an enhanced version of this graphic, please visit:
https://images.newsfilecorp.com/files/8082/242057_gmg9.jpg

Patent Progress of G® Lubricant

GMG submitted a patent application on the G® Lubricant product as soon as it was possible, and this is progressing through the usual process to be approved for the main target markets.

About GMG:

GMG is an Australian based clean-technology company which develops, makes and sells energy saving and energy storage solutions, enabled by graphene manufactured via in house production process. GMG uses its own proprietary production process to decompose natural gas (i.e. methane) into its natural elements, carbon (as graphene), hydrogen and some residual hydrocarbon gases. This process produces high quality, low cost, scalable, ‘tuneable’ and low/no contaminant graphene suitable for use in clean-technology and other applications.

The Company’s present focus is to de-risk and develop commercial scale-up capabilities, and secure market applications. In the energy savings segment, GMG has initially focused on graphene enhanced heating, ventilation and air conditioning (“HVAC-R”) coating (or energy-saving coating) which is now being marketed into other applications including electronic heat sinks, industrial process plants and data centres. Another product GMG has developed is the graphene lubricant additive focused on saving liquid fuels initially for diesel engines.

In the energy storage segment, GMG and the University of Queensland are working collaboratively with financial support from the Australian Government to progress R&D and commercialization of graphene aluminium-ion batteries (“G+AI Batteries”). GMG has also developed a graphene additive slurry that is aimed to improve the performance of lithium-ion batteries.

GMG’s 4 critical business objectives are:

  1. Produce Graphene and improve/scale cell production processes
  2. Build Revenue from Energy Savings Products
  3. Develop Next-Generation Battery
  4. Develop Supply Chain, Partners & Project Execution Capability

For further information please contact:

  • Craig Nicol, Chief Executive Officer & Managing Director of the Company at craig.nicol@graphenemg.com, +61 415 445 223
  • Leo Karabelas at Focus Communications Investor Relations, leo@fcir.ca, +1 647 689 6041

Neither the TSX Venture Exchange nor its Regulation Services Provider (as that term is defined in the policies of the TSX Venture Exchange) accept responsibility for the adequacy or accuracy of this news release.

Cautionary Note Regarding Forward-Looking Statements

This news release includes certain statements and information that may constitute forward-looking information within the meaning of applicable Canadian securities laws. Forward-looking statements relate to future events or future performance and reflect the expectations or beliefs of management of the Company regarding future events. Generally, forward-looking statements and information can be identified by the use of forward-looking terminology such as “intends”, “expects” or “anticipates”, or variations of such words and phrases or statements that certain actions, events or results “may”, “could”, “should”, “would” or will “potentially” or “likely” occur. This information and these statements, referred to herein as “forward‐looking statements”, are not historical facts, are made as of the date of this news release and include without limitation, the potential of G Lubricant to optimize efficiency and power for stationary or mobile engines, the potential of G Lubricant to reshape the future of the global liquid fuels industry, GMG’s intention to commercialise and market G Lubricant, the progress of the Company’s patent applications, the potential market for G Lubricant and the potential revenue available for G Lubricant.

Such forward-looking statements are based on a number of assumptions of management, including, without limitation that G Lubricant has the potential to optimize efficiency and power for stationary or mobile engines, that G Lubricant has the potential to reshape the future of the global liquid fuels industry, that GMG will commercialize and market G Lubricant, that the Company’s patent applications will progress as anticipated, and that the potential market and revenue available for G Lubricant will be as currently forecasted. Additionally, forward-looking information involves a variety of known and unknown risks, uncertainties and other factors which may cause the actual plans, intentions, activities, results, performance or achievements of GMG to be materially different from any future plans, intentions, activities, results, performance or achievements expressed or implied by such forward-looking statements. Such risks include, without limitation: that G Lubricant will not offer an innovative solution that optimizes efficiency and power for stationary or mobile engines, that G Lubricant will not reshape the future of the global liquid fuels industry, that GMG will commercialize and market G Lubricant as anticipated, that the Company’s patent applications will not progress as currently anticipated, that the potential market and revenue available for the G Lubricant product is not as currently calculated, risks relating to the extent and duration of the conflict in Eastern Europe and its impact on global markets, the volatility of global capital markets, political instability, the failure of the Company to obtain regulatory approvals, attract and retain skilled personnel, unexpected development and production challenges, unanticipated costs and the risk factors set out under the heading “Risk Factors” in the Company’s annual information form dated October 3, 2024 available for review on the Company’s profile at www.sedarplus.ca.

Although management of the Company has attempted to identify important factors that could cause actual results to differ materially from those contained in forward-looking statements or forward-looking information, there may be other factors that cause results not to be as anticipated, estimated or intended. There can be no assurance that such statements will prove to be accurate, as actual results and future events could differ materially from those anticipated in such statements. Accordingly, readers should not place undue reliance on forward-looking statements and forward-looking information. Readers are cautioned that reliance on such information may not be appropriate for other purposes. The Company does not undertake to update any forward-looking statement, forward-looking information or financial out-look that are incorporated by reference herein, except in accordance with applicable securities laws. We seek safe harbor.


[1] ABS Source: https://www.abs.gov.au/statistics/industry/tourism-and-transport/survey-motor-vehicle-use-australia/latest-release

[2] Using EIA diesel volumes for 2023 and www.globalpetrolprices.com diesel prices per country as of January 15th 2025

Corporate Logo

To view the source version of this press release, please visit https://www.newsfilecorp.com/release/242057